
Video
Consumer Financial Health: Record Lows and Highs

Curtis Diaz, CFP
Consumers are complaining about high prices, yet retail sales are up 7% year-over-year. Household net worth hit a record $183 trillion in early 2026, but credit card debt just crossed $1.3 trillion.
What is actually going on with the U.S. economy?
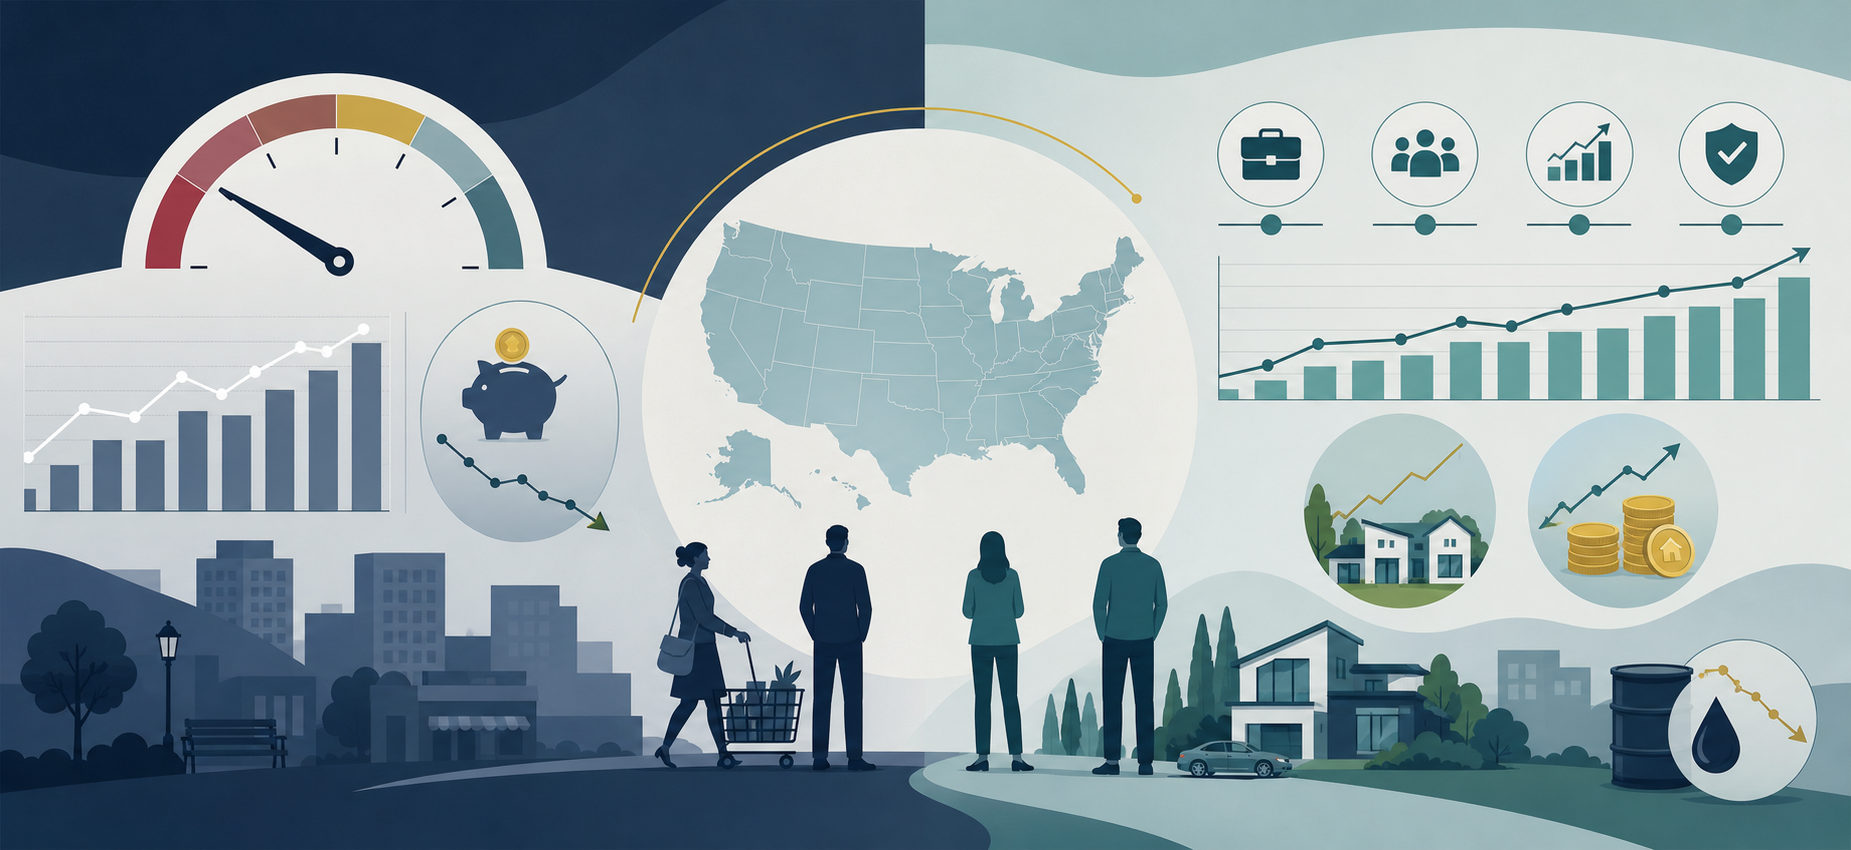
Here is a quick look at the "K-shaped" consumer reality, what the data actually says, and what it means for your portfolio.
1. The Sentiment Gap: Moody Moods, Open Wallets
- The Vibe Check: Consumer sentiment sits at 49.5 (historical average is ~84)—putting overall sentiment near 2008 recession levels.
- The Reality: Retail sales are still booming. Higher prices on everyday items like groceries and housing make people feel pessimistic, but steady wages mean they keep buying necessities and discretionary items anyway.
2. The K-Shaped Economy
- The Top Arm: Rising stock markets and record home equity pushed total household net worth to new highs, benefiting asset owners.
- The Bottom Arm: Higher living costs have forced others to rely on debt. Auto loans ($1.7T), student loans ($1.7T), and credit cards ($1.3T) are taking a heavy bite out of monthly budgets.
3. The Savings Squeeze
- The personal savings rate dropped to 3% (well below the historical norm).
- Why? Sticky inflation leaves less extra cash per paycheck, and retiring Baby Boomers are now spending down their nest eggs rather than saving.
The Bottom Line for Investors
Despite the split narrative, aggregate economic data, low unemployment, and corporate earnings remain solid. Oil prices pulling back from recent highs offers an added relief valve for household budgets.
In a K-shaped environment, relying on high-level headlines isn't enough—your financial strategy needs to account for how these trends impact your specific goals, debt, and long-term compounding.
Have questions about how current market conditions affect your wealth plan? Send us a message or schedule a quick chat with our team today!